To add a table to your report open the Toolbox and drag and drop the Table icon on to the design surface. By default the table has three columns. You can add or remove columns by right-clicking on the column selector and choosing the appropriate command from the context menu. By default the table has a header, a detail row and a footer. Any of these items can be hidden if not needed, by right-clicking on the row selector and choosing the appropriate command from the context menu.
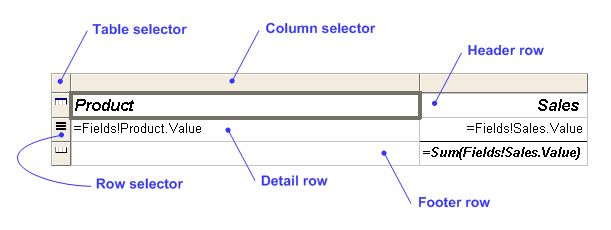
To display data in the table drag and drop fields into the detail row. When a field is dropped into the detail row Report Designer automatically sets a default column name in the table header. To display summary data drag and drop fields into the footer row. When a numeric field is dropped into the footer row notice that Report Designer automatically wraps the field in the Sum() function.
At the top left corner of the table is the table selector. Clicking on the table selector will select the table, and you can change its properties through the property panel. To open the Table Properties dialog right-click on the table selector and choose the Properties command from the context menu.
By default, each cell in the table contains a Textbox. You can set its properties using the Textbox Properties dialog. To open the Textbox Properties dialog right-click on the table cell and choose Properties from the context menu. As an example, you can format the number displayed in a textbox as a currency by opening the Textbox Properties dialog, switching to the Format tab, and entering a format code. See this page for numeric format codes, or this page for date format codes.
You can change the font, background color etc by clicking on a cell and then modifying the corresponding properties using the property panel. To style an entire row click on the the row selector to select the row, and then modify its properties using the property panel.
You can get traditional "green bar" style tables by setting the
BackgroundColor property of the detail row to this expression:
=iif(RowNumber(Nothing) mod 2, "#CCFFCC", "White")
To add a grouping right-click on the row-selector and choose "Insert Group". The Grouping and Sorting Properties dialog opens. Click in the grid under Group on and select the field to group on. All other values in this dialog are optional. Click OK to close the dialog. Back on the design surface new group header and footer rows appear in the table. Enter expressions for group heading and summary in the header and footer rows respectively.
In the example below there are two levels of grouping. To merge cells as seen in this example, shift-click the cells and then from the right-click menu choose Merge Cells.
Tip: You can move a textbox from one table cell to another by clicking on the textbox and dragging the gray border of the textbox.
Table with groups: Download sample app.
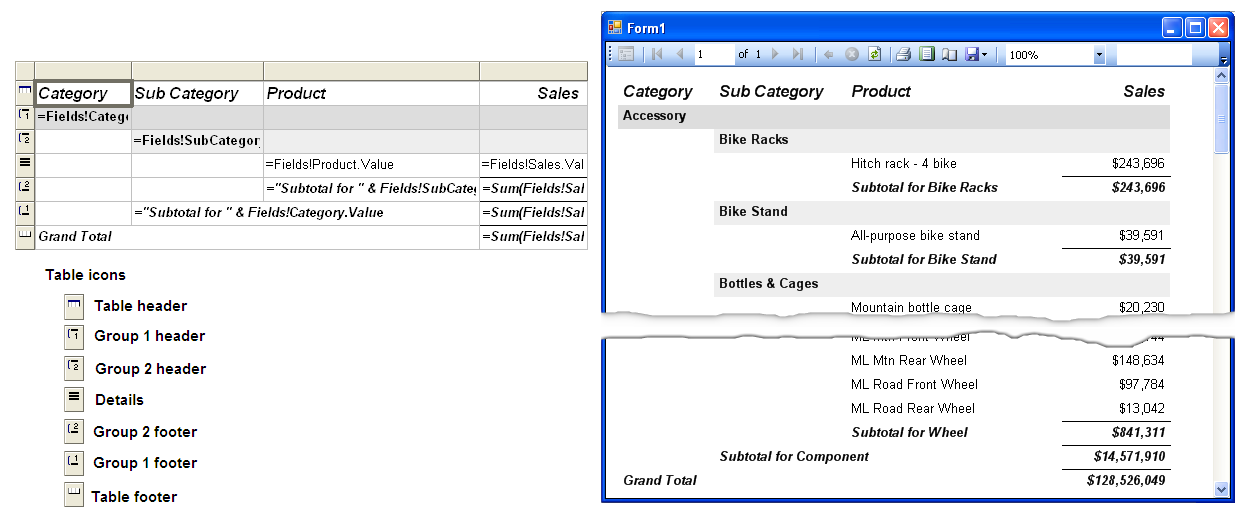
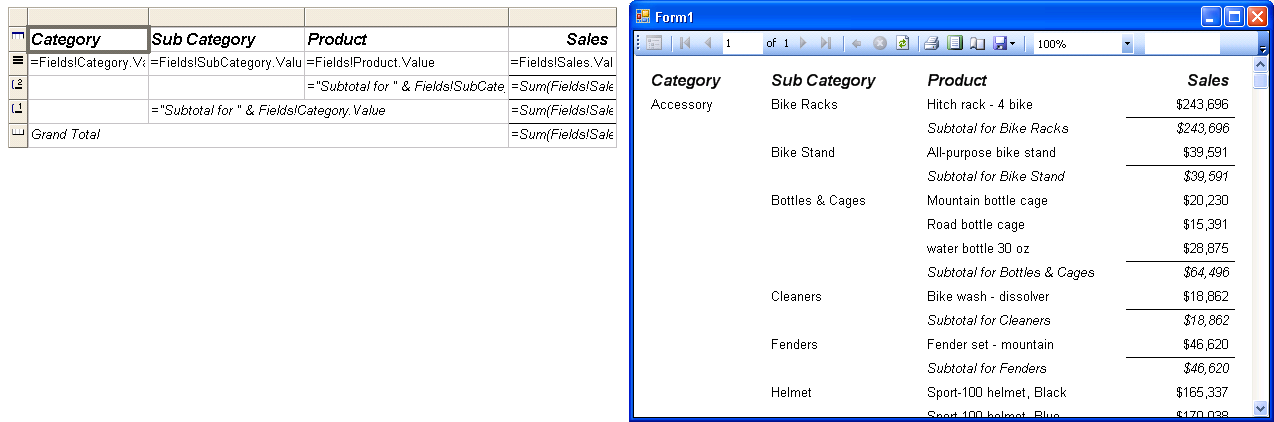
In the screenshot above of the running application notice how text "steps down" as you move from outer group to inner group. You may prefer the "block style" where this stepping down does not occur, as seen in the screenshot below.
To get a block style table delete the group header rows by right-clicking on them and choosing the "Delete Rows" command from the context menu. Then for each textbox in the detail row, if there is a grouping on the field displayed in the textbox then turn on the HideDuplicates flag on the textbox as follows: Right-click on the table cell and choose the Properties command from the context menu to open the Textbox Properties dialog. Then check the Hide duplicates checkbox. In the Containing group or dataset dropdown click on the DataSetName of the table. (Note about terminology: The term 'Dataset' here does not refer to ADO.NET datasets. It refers to RDL datasets, which is closer to a datatable.)
Block style table: Download sample app.
You may wish to only display subtotals in the table. One way to accomplish this is to insert a group, then delete the details and the group footer rows, and then display the group name and subtotals in the group header row.
Another way to accomplish this is by taking advantage of the Details Grouping feature. Right-click on the row selector of the details row and choose the "Edit Group" command from the context menu. This opens the Details Grouping dialog. Enter the Group on expression and click OK. Now enter expressions in the detail row to display the group name and subtotals.